State and Local Spending on the Administration of Elections: Insights From a Review of 12 States and 93 Localities
For decades, there have been resounding issues with funding elections across the country. Outside of lack of federal funding for elections, one of the main reasons for this is that the systems for financing the administration of elections are as decentralized and varied as the systems for conducting elections. This paper reviews experiences and elections budgets from 12 states to better educate those in the electoral space about the dire need for more funding.
Introduction
The responsibility for the administration of elections is largely decentralized in the United States, and states exercise wide discretion in how elections are conducted. Most states further share and decentralize responsibility with over 10,000 local election jurisdictions across the country.1 The systems for financing the administration of elections are as decentralized and varied as the systems for conducting elections.2 In general, the expenses for elections are borne by local governments and taxpayers, with varied but relatively little support from state governments.3
To better understand the variation in the financing of elections, the Institute for Responsive Government reviewed state and local budgets for the administration of elections in 12 states (Arizona, Colorado, Idaho, Indiana, Kentucky, Massachusetts, Michigan, Montana, New York, North Carolina, South Carolina, and Virginia) and 93 localities within nine of those states4 for the fiscal year in which the 2020 presidential general election was held.5 The following insights emerged:
- State and local election budgets are primarily funded with general fund dollars that also fund other high priority state and local services, like education, health care, law enforcement, and corrections. In many states, the bulk of election-related expenditures are paid for with local taxpayer dollars.
- The decentralization of elections funding appears to result in wide disparities in the amount of local spending per citizen voting age population (CVAP), potentially pointing toward a corresponding disparity in the level of access and services available to voters. Without consistent state and federal funding to support elections, the availability of funding for elections may be largely determined by the local economy and tax base, the competing needs of the community, and the policy decisions of local leaders.
- More research is needed, but local spending may be higher on average in states where the state spends less on elections. The existing data points to the logical conclusion that states can relieve fiscal pressure on localities by providing funding to localities and/or by spending more directly on election-related responsibilities that would otherwise be borne by localities (e.g., technology, poll workers, ballot printing and mailing). The data also suggests that federal and philanthropic funders may want to consider the distribution of financial responsibility within states when considering avenues, formulas, and requirements governing the distribution of additional funding.
- Data from several states indicates that economies of scale may lead to higher costs per voter in smaller population counties than larger population counties. One reason states may want to consider providing additional support for local elections administration is the potential variability in cost factors among rural, urban, and suburban localities. The variability in cost drivers could be exacerbating disparities caused by other factors, such as the size of the tax base, the corresponding availability of tax revenue, and competing demands on the budget.
A Note of Caution About Comparing Data Between Jurisdictions
Fiscal elections data is difficult to both find and use, as summarized by a 2022 cost report by the MIT Election Data & Science Lab:
Information about the cost of conducting elections is so elusive because states and localities differ in how election functions are accounted for in budgets. Plus… the amounts are such a small portion of local government budgets that it rarely occurs to officials to separately report spending on elections. Because so many employees who work in elections have other duties, accurately allocating expenses to elections can be a challenge.
The costs of conducting elections are largely borne by local governments and are often subsumed within the operating budget of a superior official, such as a city or county clerk. At the state level, expenditures are usually lumped into the budget of the chief election officer, who is most often the Secretary of State. Finally, the U.S. Census Bureau’s annual survey of state and local government finances, which is the authoritative annual study of state and local government taxing and spending, does not record spending for elections.6
The states and localities reviewed by the Institute for Responsive Government all had separately reported election budgets, and most had actual election expenditures delineated within their larger budgets, annual reports, and/or audits.7 However, the collection of data from states and localities that report election expenditures does not eliminate the challenges associated with reviewing and comparing data across jurisdictions. Wide variation exists between jurisdictions regarding which expenses are included and excluded within elections budgets and line items. For example, some states and localities include campaign finance duties within elections budgets, and some do not; some include administrative costs associated with the election functions, while others subsume those expenses within a larger agency or division budget. In addition, the use of data from states and localities that do report election spending may skew the data that is collected (e.g., the localities that report elections spending may spend more on average than those that do not). Furthermore, the timing of fiscal budget years differs across and between state and local governments, meaning that the data collected will not represent identical points in time.8 Finally, a snapshot of election year budgets may capture unusual one-time-only expenditures in some jurisdictions that are missed in others.
With these data limitations in mind, the Institute for Responsive Government conducted the fiscal reviews of the 12 states and corresponding localities primarily to better understand the financing mechanisms and variations within given states, while taking care not to draw direct comparisons between jurisdictions. The findings below represent a qualified analysis of the research across all 12 states and are shared in hopes of contributing to larger discussions regarding future research and policy options, while cautioning readers to avoid the temptation of making direct comparisons between jurisdictions (e.g., “X state or county spends more or less than Y state or county.”).
Findings
State and Local Election Budgets are Primarily Funded with General Fund Dollars.
State governments typically fund election-related expenditures with general fund dollars. As described by the Center on Budget and Policy Priorities, in most states, the general fund:
Is where most general tax revenue (like sales and income taxes) goes, and it pays for most of the state’s spending on education, health care, public safety, human services, and other areas….
Over half of what states spend, on average, goes to two activities: education (K-12 and college) and health care. But states also fund a wide variety of other services, such as transportation, corrections, pensions and health benefits for public employees, care for the mentally ill and developmentally disabled, assistance to low-income families, economic development, environmental protection, state police, parks and recreation, and aid to local governments.9
Similarly, local governments tend to fund election-related expenses with local general fund dollars. According to the Urban-Brookings Tax Policy Center, general local revenue is primarily derived from property, sales, and other taxes, as well as intergovernmental transfers.10 These local taxpayer dollars must support the full range of local government functions, from schools to law enforcement. In some localities, the general fund also includes a portion of election-related revenue that supplements or offsets other local taxpayer funding. In localities where election-related revenue exists, sources can include candidate filing fees, state and federal grants, and municipal reimbursements.
Guilford County, North Carolina, is illustrative. The budget for the Guilford County Board of Elections is funded primarily with county general fund dollars. The county general fund dollars include intergovernmental transfers, like reimbursements from municipal governments for municipal election costs in years when such elections are held. In FY 2021, the Board received federal funding (HAVA and CARES Act) representing 19% of the total $3.8 million election budget, with the remainder of the budget covered by other county general fund dollars.11
Guilford County general funds are, in turn, comprised primarily of property tax revenue. In FY 2021, property tax revenue made up 62% of the Guilford County general fund, sales tax 16%, and federal and state funding 13%.12
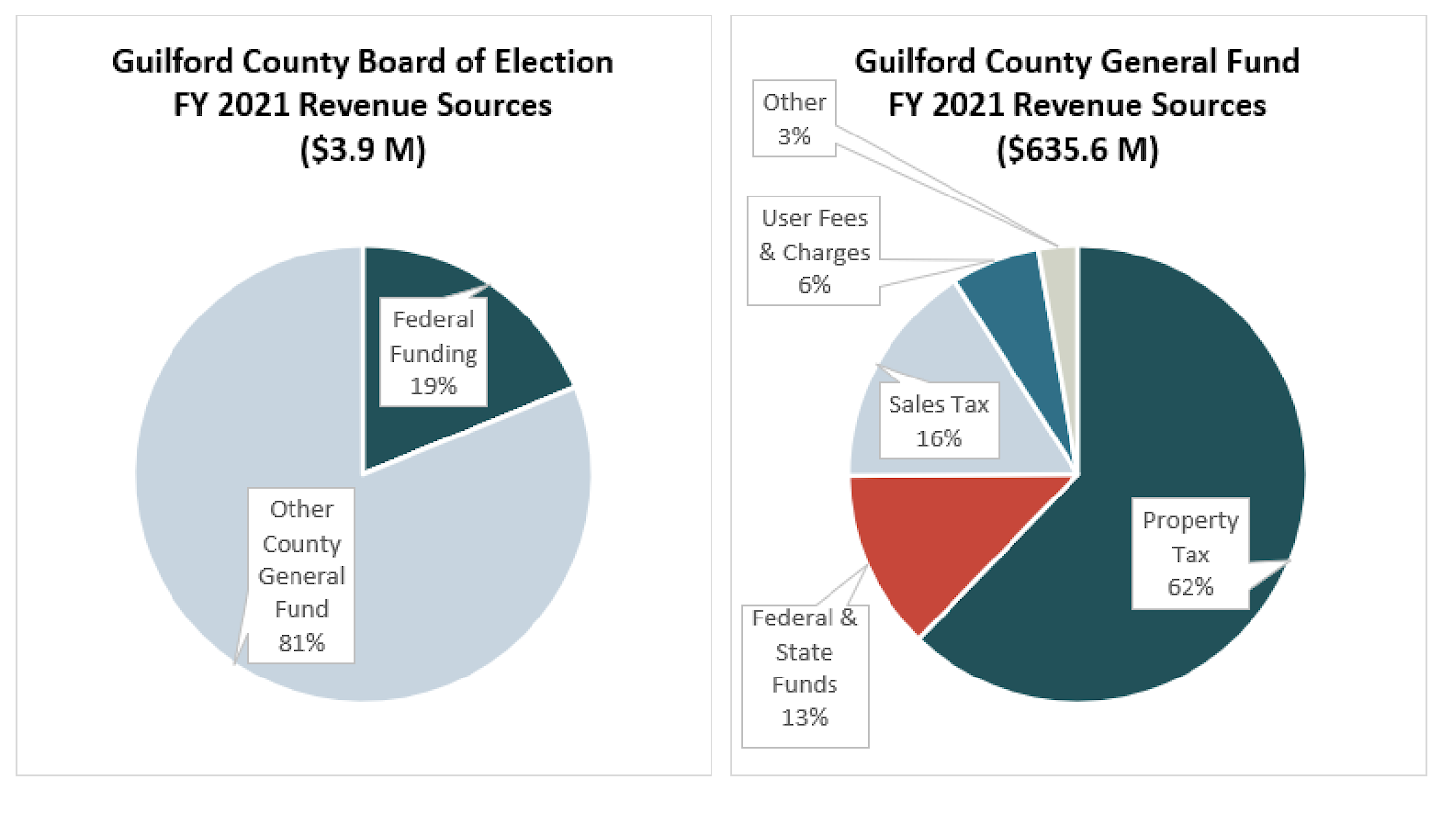
In terms of expenditures, the Guilford County general fund is primarily used to support education (51% of general fund expenditures in FY 2021), as well as public health, child support enforcement, social services, law enforcement, parks and recreation, emergency services, and animal services.13
In virtually all jurisdictions, state and local financing for elections must compete with these other critical government functions. Without consistent state and federal funding to support elections, the availability of funding – and the corresponding access and services available to voters – may be largely determined by the local economy and tax base, the competing needs of the community, and the policy priorities of local leaders.
States and Localities Spend a Very Small Portion of Total General Fund Revenue Supporting Elections Administration, but Variations Exist.
In his review of previous studies for the MIT Lab, Professor Charles Stewart III estimated that the cost of administering elections accounts for just .25% of all local government spending.
“The estimated cost of conducting elections on an annual basis is roughly what local governments spend managing public parking facilities.”14 Of the localities reviewed by the Institute for Responsive Government, localities spent an average of .89% of their total general fund revenue on the administration of elections in the fiscal year in which the 2020 presidential general election was held, and states spent an average of just .08%.
As noted above, spending during presidential general elections likely represents a high-water mark in cyclical spending, and significant non-recurring federal and philanthropic funding was also available to support state and local governments for the 2020 election.
The Center for Tech and Civic Life provided nearly $350 million in critical COVID-19 Response Grants during the 2020 elections. Funding is likely included in the total local expenditure data for the localities that received those grants. (The inclusion of this non-recurring source of external revenue for some jurisdictions is one example of why point-in-time comparisons between jurisdictions are so difficult.)
As important as the CTCL grants were for struggling localities, the funding likely represents a small portion of overall local spending on elections. The Institute for Responsive Government looked at 94 out of over 10,000 localities (less than 1%), and the local spending on elections across this small fraction totaled $519 million, while CTCL reports distributing $350 million nationwide. For more information about the COVID-19 Response Grants, visit TechAndCivicLife.org.
Many Local Budgets for Elections Administration are Cyclical, with Increased Spending During State and National General Elections.
For a subset of states (Arizona, Colorado, Michigan, Montana, and North Carolina) and associated localities, the Institute for Responsive Government reviewed at least four years of fiscal data to better understand any fluctuations that may occur over time and throughout an election cycle. Many of the localities reviewed experienced higher expenditures during years which contained the presidential primary election (FY 2020, CY 2020) or presidential general election (FY 2021, CY 2020). Fluctuations were sometimes also associated with increases in funding from state, federal, or private funders.
For example, during the four-year period from fiscal year 2019 to fiscal year 2022, the elections department budget of Maricopa County, Arizona, reached a high of $35.6 million in FY 2021, (the year in which the presidential general election occurred), $13 million higher than any other year during the election cycle.15 The high expenditures in FY 2021 also corresponded with increases in revenue from intergovernmental sources, non-recurring Coronavirus Relief funding, and non-recurring elections grants.16
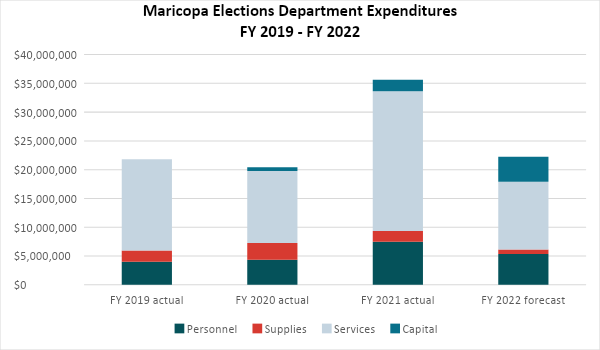
Although the 2020 election season was extraordinary in both the demands placed on elections departments and on the outside revenue available to assist with those demands (both federal and philanthropic), Maricopa County budget documents indicate that the election budget fluctuates with the election cycle regardless of those unusual circumstances.17
The federal government and state governments can help alleviate the fiscal pressure placed on localities by offering financial support that acknowledges the fluctuating demands of the election cycle, as some states do by reimbursing some or all of the costs related to certain kinds of elections (most commonly presidential primaries).18
The Decentralization of Elections Funding Appears to Result in Wide Disparities in the Amount of Local Spending Per Citizen Voting Age Population (CVAP).
As the Center for Tech and Civil Life has noted, the shortage in funding for local elections departments “is pervasive, but it isn’t universal – and it heavily depends on where [the elections departments] are located…. There can be radically different levels of funding, even when jurisdictions have roughly the same number of eligible voters.”19
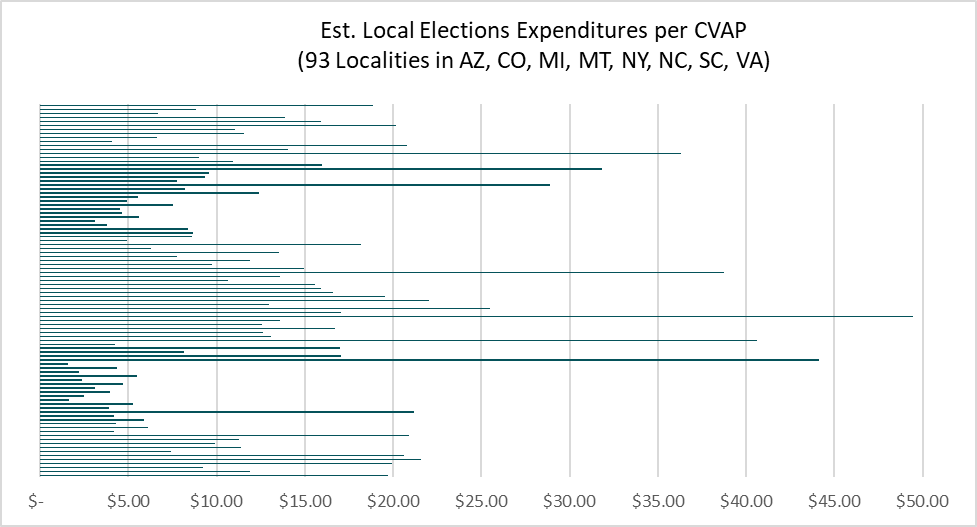
To better understand these variations, for each locality studied, the Institute for Responsive Government looked at the elections-related expenditures for the fiscal year in which the 2020 presidential general election was held (FY 2021 or CY 2020) divided by the 2017-2021 Citizen Voting Age Population 5 Year Estimates.20 Of all of the localities reviewed by the Institute for Responsive Government, the locality with the lowest level of spending, expended just $1.61 per CVAP, while the locality with the highest level of spending expended $49.43 per CVAP. The chart below shows the spending per CVAP for all 93 localities reviewed.
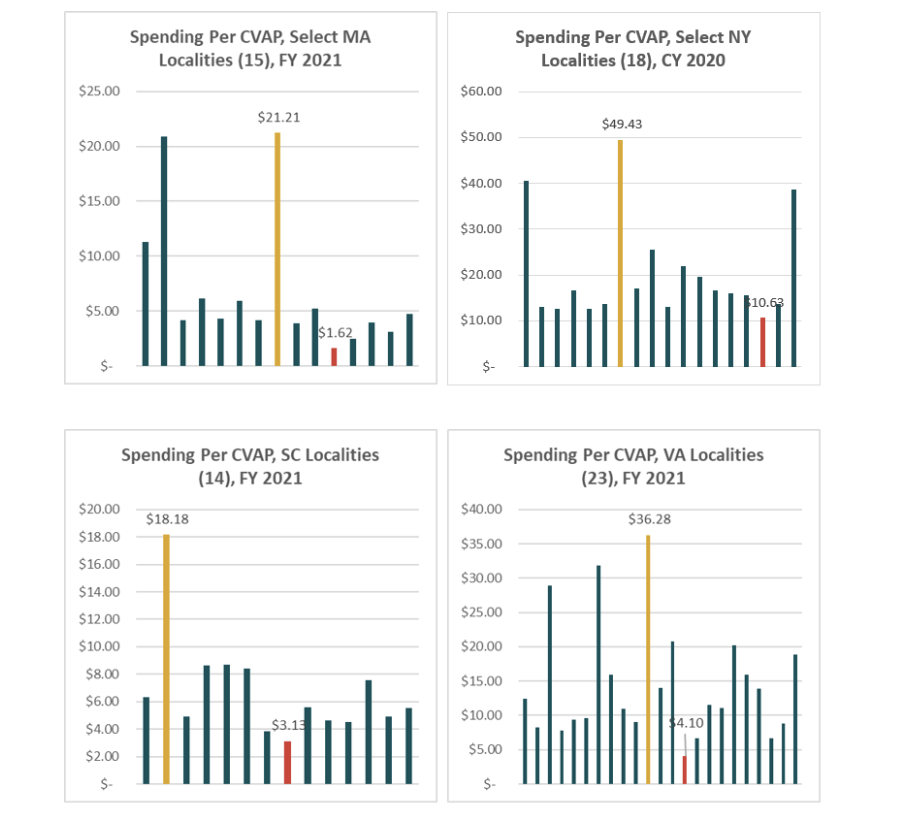
One possible explanation for some of the variation in spending across localities is that the responsibilities falling on local governments versus the state government varies from state to state (discussed in more detail below). Although these differences may partially explain variation in local spending between states, it cannot explain the significant variation that remains within states. The charts below show the significant range in expenditures per CVAP within the states of Massachusetts, New York, South Carolina, and Virginia (the states for which the Institute for Responsive Government collected the most local data).
Even with the significant caveats regarding comparing expenditure data across jurisdictions, the variation is notable and consistent with previous findings of wide variation between localities. Many factors may contribute to the large variation, but if the amount expended per CVAP locally can serve as any reasonable proxy for the level of democratic access and election services for voters in a particular locality, the data points to potentially large disparities among voters based entirely on their zip codes.
More Research is Needed, but Local Spending May be Higher on Average in States Where the State Spends Less on Elections.
Some of the variation in local spending per CVAP between states may be explained by variations in state spending. For example, of the states reviewed by the Institute for Responsive Government, the state of South Carolina had the highest state funding per CVAP ($8.64/CVAP) and the lowest weighted local average expenditure per CVAP across the localities reviewed ($5.65/CVAP). The following graph shows the weighted average of local spending per CVAP and average state spending per CVAP for Massachusetts, New York, South Carolina, and Virginia.
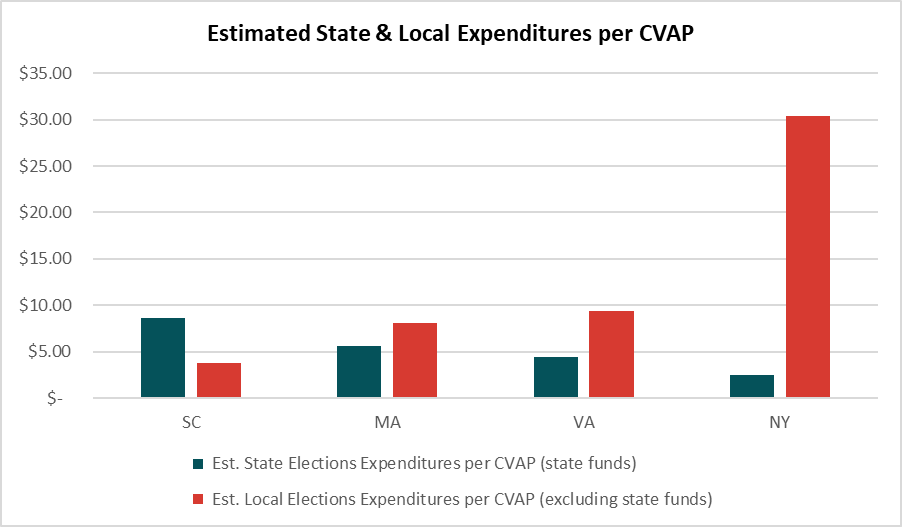
Although additional research is necessary, the existing data points to the logical conclusion that states may relieve fiscal pressure on localities by providing funding to localities and/or by increasing direct spending on election-related expenditures that would otherwise be borne by localities (e.g., technology, poll workers, ballot printing and mailing).
The data also suggests that future research on election spending may want to avoid looking at state and local spending in isolation of each other. Furthermore, both federal and philanthropic funders may want to consider the distribution of financial responsibility within a state when considering avenues, formulas, and requirements governing the distribution of additional funding.
Data From Several States Indicates That Economies of Scale May Lead to Higher Costs Per Voter in Smaller Population Counties Than Larger Population Counties.
Previous research on elections spending has found economies of scale can lead to higher costs per voter in smaller population counties than larger population counties, with one research paper on the subject stating, “[T]here is general agreement that economies of scale apply for election expenditures. The larger the population served, the lower the cost per voter.”21 The research conducted by the Institute for Responsive Government cannot conclusively contribute to this finding, but several data points appear to be consistent with the research. For example, the three smallest localities by population in Virginia had the three highest expenditures per CVAP of the localities reviewed in FY 2021. Similarly, in South Carolina, the smallest county reviewed spent significantly more per CVAP ($17.14) than the other counties reviewed, while the largest county reviewed spent less per CVAP ($3.84) than any other county but one (the fourth largest county). In New York State, the smallest county reviewed had the highest spending per CVAP at $49.43. However, New York City, by far the largest locality reviewed, had the second highest spending per CVAP, and the fifth largest locality reviewed, had the third highest spending per CVAP.
Although further research would be necessary to determine the relationship, if any, between the size of the population and the cost of elections administration,22 one reason states may want to consider providing additional financial support for local elections administration is the variability in cost factors among rural, urban, and suburban localities. The variability in cost drivers could be exacerbating disparities caused by other factors, such as the local economy and tax base, the competing needs of the community, and the policy decisions of local leaders.
Many States Offer Some State Funding to Support Local Election Administration Budgets, but the Level, Consistency, and Sources of Funding Vary Greatly.
Among the states reviewed by the Institute for Responsive Government that provide funding to local governments, wide variations exist regarding what, how, and how much of local expenses are reimbursed. Of the 12 states reviewed, a quarter of them appeared not to provide any state funding to localities to support elections administration in FY 2021. Of the eight reporting some level of state funding to localities, the amounts reported varied from a low of $.51 per CVAP to a high of $3.74 per CVAP.
Summary of State Support for Localities
In Colorado, currently the state “reimburses counties for costs related to primary elections and statewide ballot issues on a ‘per voter’ basis.” In addition, since FY 2020, the legislature has made funding available to reimburse counties for purchasing and securing voting equipment in compliance with new state voting equipment and election security standards. In FY 2021, Colorado distributed $5 million to local governments, an average of approximately $1.19 per CVAP.23
Additionally, in 2023, Colorado increased ongoing state reimbursements for county election costs; beginning in FY 2025, the Department of State will reimburse counties for 45% of the costs of “any election with state-certified ballot content.” The fiscal note for the enacting legislation anticipates reimbursements in the amount of $4.9 million in FY 2025 and $7.8 million in FY 2026.24
In Idaho, a portion of the state sales tax goes to counties to help offset costs associated with conducting elections. At least $4.1 million is distributed each year, adjusted for inflation. In FY 2021, $4.9 million was distributed to counties, approximately $3.74 per citizen voting age population (CVAP). In addition, Idaho reimburses counties for costs related to presidential primaries ($2 million appropriated in FY 2020).25
Kentucky provides three ongoing sources of state funding that support county elections administration: (1) state share of county election expenses at a rate of $255 per precinct in the county; (2) payments based on new registered voters at a rate of $.25 for each new registered voter; and (3) payments based on total registered voters for “the cost of employing office personnel necessary for the conduct of elections, including the registration and purgation of voters in the county, up to $.50 per registered voter.” In FY 2021, distributions to counties totaled $3.6 million, an average of approximately $1.07 per CVAP.26
Grants or subsidies for elections distributed by the State of Massachusetts include ad hoc subsidies for early voting; grants for voter registration and education; ongoing funding to localities for incremental costs associated with implementing state law requiring uniform polling hours; and, beginning in FY 2023, grants for the new American grants program, which is designed to “ensure compliance with the language access mandate” of the Voting Rights Act. In FY 2021, the Secretary of the Commonwealth distributed $4.9 million in grants and subsidies, an average of $.96 per CVAP.27
Currently Michigan provides a relatively small amount of funding to counties “for costs associated with processing voter registration applications” (just over $110K budgeted in FY 2021, $.00 per CVAP). The state also reimburses counties, townships, and cities for the costs of presidential primary elections, distributed by the Michigan Department of Treasury. A total of $17.6 million was distributed in FY 2020.28
Additionally, in 2023, Michigan created the “election administration support fund” and approved “[u]p to $30.0 million of the [almost $46 million allocated to the new fund] … for grants to counties to coordinate city and township early voting sites.”29
The New York budget historically has included fluctuating line-items to support local governments for expenses related to the administration of elections such as costs for return postage on absentee ballots, costs related to expanding early voting, and costs to provide accessibility for voters with disabilities. The state support does not appear to be mandated by state law but depends on the annual priorities of the legislature and executive. Between FY 2019 and FY 2022, state support to local governments fluctuated from a high of $7.2 million in FY 2021 ($.51 per CVAP) to a low of just $5,000 in FY 2019.30
South Carolina reimburses some election-related expenses incurred by counties for statewide elections, including for county poll workers and county election board member stipends. In even numbered fiscal years, counties are reimbursed for statewide primaries and runoffs. In odd numbered fiscal years, counties are reimbursed for expenses related to the general election. In FY 2021, $7.1 million was distributed to counties, an average of approximately $1.86 per CVAP.31
Virginia reimburses counties for the salaries of the general registrars, who serve as the directors of elections in Virginia’s cities and counties, and for the compensation of secretaries and members of the local electoral boards. In FY 2021, $6.8 million was distributed to localities, an average of approximately $1.09 per CVAP. In addition, state law requires the state to pay for the cost of the presidential primary. For FY 2020, up to $5.8 million was appropriated to “reimburse localities for their presidential primary expenditures.”32
Federal Funding is an Important but Relatively Small and Inconsistent Source of Election Funding and is Not Always Available to Directly Support Local Governments.
An in-depth look at federal funding for elections is beyond the scope of this paper and has been well covered by other sources, including in-depth reports by the United States Election Assistance Commission on state awards and reported uses, but a couple of notes are worth highlighting in the context of state and local funding dynamics. For the first time since 2010, Congress authorized a new round of election funding available to the states via HAVA Election Security Grants in 2018 and 2020, totaling $805 million. States reported using the funding on important elections-related expenditures including voting equipment, post-election auditing, voter registration systems, cybersecurity, and communications.33 As important as this and other federal funding has been to the states, even in the years the funding is granted, the federal funds make up a relatively small portion of total state and local spending on elections. To give just one example, Virginia was awarded $19.3 million total via 2018 and 2020 federal election security grants. In comparison, in FY 2021 alone, the state reported expending $27.4 million in state funds, and the 23 localities reviewed by IRG (representing 53% of the estimated CVAP population) spent $35 million.34
Conclusion
Although significant elections policy gets decided at the state level, in most states, the resources made available to carry out those policies are largely dependent on local budgeting decisions.35 The decentralization of elections financing means that individuals and organizations that care about the fairness and security of elections will need to consider engaging with local leaders during budget approval processes- an admittedly daunting task with over 10,000 local elections administrators in the country.
The heavy reliance on local taxpayer dollars to fund the administration of elections has other consequences, including wide disparities in election-related expenditures. Although the decentralization of elections is deeply embedded in American law and history, more could be done to minimize the potential consequences of the decentralization of elections funding. Both the federal and state governments could provide additional and more consistent funding to ease the burden on local governments and to address any disparities that result from current funding mechanisms. On average, less than one-tenth of one percent of state general fund dollars were spent on elections administration among the 12 states reviewed by the Institute for Responsive Government, and only a small fraction of that went to provide financial support to local governments. At that scale, significant increases could be made to support local governments in their efforts to keep elections safe, secure, and open, without putting undue burden on other areas of state budgets.
1 “Election Administration at State and Local Levels,” Updated November 1, 2023, https://www.ncsl.org/elections-and-campaigns/election-administration-at-state-and-local-levels. The areas of resulting variation across and within states include how state and local elections administrators are selected; whether responsibilities for elections and voter registration rest with one person, a commission or board, or are shared; the qualifications of and training for state and local administrators; the functions of administration maintained by the state versus those borne by localities; the unit of local government primarily responsible for conducting elections (i.e., counties versus city and towns); the level of support and supervision provided by states to local administrators; ballot design, printing, and distribution; and time, location, and methods of voting. Kathleen Hale, Robert S. Montjoy, and Mitchell Brown, “The Structure of Election Administration at State and Local Levels,” in Administering Elections. Elections, Voting, Technology. (Palgrave Macmillan, 2015), https://doi.org/10.1057/9781137388452_2.
2 Numerous previous studies have found that financial responsibility for the administration of elections lies primarily with local governments, with wide variation in the level of local funding – and resulting services – available for elections. See for example, Charles Stewart III, “The Cost of Conducting Elections,” MIT Election Data & Science Lab, 2022, https://electionlab.mit.edu/sites/default/files/2022-05/TheCostofConductingElections-2022.pdf.
3 Stewart, “The Cost of Conducting Elections,” 4. Many states provide some state funding to support local election administration budgets but the amounts are relatively small. In 2018, a national review of state funding for elections administration conducted by the National Center for State Legislatures found that 33 states have ongoing requirements to fund a portion of local costs related to elections administration, ranging from Alaska and Delaware, where the states pay the entire costs, to a majority of additional states that provide partial or total reimbursements for certain statewide, special, or presidential primary and general elections. National Center for State Legislatures, “The Price of Democracy: Splitting the Bill for Elections,” 2018.
4 All but Idaho, Indiana, and Kentucky, which lacked sufficient available local data to include.
5 For most jurisdictions, the presidential general election occurred during fiscal year 2021. For a minority, the fiscal year follows the calendar year, and thus the presidential general election occurred during fiscal year 2020. The local sources utilized were selected based on which source provided the most detailed accounting for the fiscal year which included the 2020 presidential general election. Actual expenditures were used when available. Sources for and notes regarding the local data are included in Appendix A.
6 Stewart, “The Cost of Conducting Elections,” 4.
7 The local source notes in Appendix A indicate instances in which election budgets included or may have included non-election related expenditures and/or actual 2021 expenditure data was not available.
8 For example, most of the states and localities reviewed for this report use fiscal years that run from summer or fall of one year into the next year (i.e., from July 1, 2020, through June 30, 2021 (FY 2021)), such that the presidential primary election and general election would occur during two different fiscal years. In those jurisdictions, only expenditures related to the presidential general election were likely captured. In contrast, in a limited number of the localities reviewed, the fiscal years ran concurrent with the calendar year so that expenditures for those localities included both primary and general related expenditures.
9 Center on Budget and Policy Priorities, “State Policy Basics: The ABCs of State Budgets,” February 2013.
10 Urban-Brookings Tax Policy Center, “Tax Policy Briefing Book: The State of State (and Local) Tax Policy,” 2020, 7, https://www.taxpolicycenter.org/briefing-book.
11 Guilford County, North Carolina, “FY 2023 Adopted Budget,” 157, https://www.guilfordcountync.gov/home/showpublisheddocument/13156/637946922174900000; Guilford County, North Carolina, “Compliance Report as of and for the Year Ended June 30, 2021, and Reports of Independent Auditor,” 17, https://www.guilfordcountync.gov/home/showpublisheddocument/12708/637805123415270000.
12 Guilford County, North Carolina, “FY 2023 Adopted Budget,” 66.
13 Ibid., 77-78.
14 Stewart, “The Cost of Conducting Elections,” 3.
15 Author’s calculations derived from Maricopa County, Arizona, “Budgets,” FY 2021, FY 2022, and FY 2023, accessed September 5, 2023, https://www.maricopa.gov/3668/Budget-Documentsv. Although the presidential primary occurred prior to the beginning of the FY 2021 fiscal year, the analysis for the FY 2021 Adopted Budget indicates that FY 2021 expenditures included both the primary and general elections. Maricopa County, FY 2021 Adopted Budget, 363, https://www.maricopa.gov/ArchiveCenter/ViewFile/Item/5089.
16 Maricopa County, FY 2023 Adopted Budget, 338, https://www.maricopa.gov/DocumentCenter/View/78428/FY-2023-Adopted-Budget-Book?bidId=.
17 Maricopa County, FY 2021 Adopted Budget, 363. See also e.g., Weld County Colorado’s Final 2022 Budget, explaining that “[t]he Elections budget is up $1,267,387 with two elections in 2022, versus one in 2021.” Weld County, Colorado, Weld County Final Budget 2022, 11, https://www.weld.gov/files/sharedassets/public/departments/accounting/documents/budget/2022/2022-completed-final-budget.pdf. In making future budgetary projections, the Weld County budget assumes that “[i]n election years, General Government will increase by approximately $500,000 for General Election years and $1,000,000 for Presidential Election years and drop by the corresponding amount in off-election years” Ibid., 91.
18 National Center for State Legislatures, “The Price of Democracy: Splitting the Bill for Elections.”
19 Center for Tech and Civic Life, “Election Officials Made Democracy Happen in 2020: The New Case for Predictable Government Funding,” 17, https://www.techandciviclife.org/wp-content/uploads/2021/11/Election-Officials-Made-Democracy-Happen-in-2020.pdf.
20 United States Census Bureau, “Citizen Voting Age Population Special Tabulation from the 2017-2021 5-Year American Community Survey,” https://www.census.gov/programs-surveys/decennial-census/about/voting-rights/cvap/2017-2021-CVAP.html.
21 Zachary Mohr et al., “Election Administration Spending in Local Election Jurisdictions: Results from a Nationwide Data Collection Project,” Paper (University of Wisconsin-Madison, 2018), 5, https://esra.wisc.edu/wp-content/uploads/sites/1556/2020/11/mohr.pdf.
22 Results may be state-specific and influenced by other factors. For example, in states with large metropolitan areas, higher costs associated with rent, recruitment, labor, and other expenditures may partially or wholly offset any economy of scale advantage.
23 Abby Mangus, Joint Budget Committee Staff, “Staff Budget Briefing FY 2022-23, Department of State,” December 2, 2021, 5-6, A-10-11, https://leg.colorado.gov/sites/default/files/fy2022-23_stabrf.pdf; Andrea Uhl, Joint Budget Committee Staff, “Staff Budget Briefing FY 2020-21, Department of State,” December 6, 2019, 13, https://leg.colorado.gov/sites/default/files/fy2020-21_stabrf.pdf. The Election Security Act, Senate Bill 22-153 (2022).
24 Legislative Council Staff, SB 23-276 Final Fiscal Note, pp. 2, 4.
25 Idaho Legislative Services, “Idaho Fiscal Facts,” 2020, 24, https://legislature.idaho.gov/lso/bpa/pubs/ff/; Idaho Legislative Services Office, Budget and Policy Analysis, Legislative Fiscal Report, Legislative Fiscal Reports, Fiscal Year 2021, 2020, 6-82, https://legislature.idaho.gov/lso/bpa/pubs/lfr/?y=2020; Legislative Services Office, “Idaho Fiscal Source Book 2020 Edition,” October 2020, 290, https://legislature.idaho.gov/wp-content/uploads/budget/publications/Fiscal-Source-Book/2020/Fiscal Source Book.pdf; Idaho Legislative Services Office, Budget and Policy Analysis, Legislative Fiscal Report, Legislative Fiscal Reports, Fiscal Year 2020, 2019, 6-76, LFR – Idaho State Legislature.
26 Andy Beshear and John Hicks, “2022-2024 Executive Budget, Vol. 1,” 28–31, https://osbd.ky.gov/Publications/Documents/Budget%20Documents/2022-2024%20Executive%20Budget%20Recommendation/2022-2024%20Executive%20Budget%20-Volume%20I%20(Part%20A).pdf; Ky. Rev. Stat. Ann. §§ 117.343, 345(2), 116.145. The legislature also appropriated $12.5 million in both FY23 and FY24 for grants to county clerks to purchase election equipment. Kentucky Association of Counties, “2022 Legislative Analysis Report.”
27 “Commonwealth of Massachusetts Budget Summary FY 2023 Enacted,” budget.digital.mass.go, accessed September 8, 2023, https://budget.digital.mass.gov/summary/fy23/enacted/independents/secretary-of-state/?tab=historical-budget; Division of Local Mandates, “Certification of Mandated Municipal Costs Associated with Early Voting in the 2020 State Primary and General Election,” May 18, 2021, accessed April 4, 2023, https://www.mass.gov/decision/certification-of-mandated-municipal-costs-associated-with-early-voting-in-the-2020-state-primary-and-general-election; Division of Local Mandates, “Uniform Polling Hours Cost Certification Dashboard,” Mass.gov, February 22, 2022, accessed September 8, 2023, https://www.mass.gov/info-details/uniform-polling-hours-cost-certification-dashboard.
28 “FY2021 Detailed Financial Report – Statewide Authorization Disposition Total (All BFYs), Summary by Appropriation and Fund,” 157, https://www.michigan.gov/budget/-/media/Project/Websites/budget/Fiscal/Spending-and-Revenue-Reports/Detailed-Financial-Schedules/FY-2021-Summary-by-Appropriation-and-Fund.pdf?rev=7d1a3a563e9c48ef914e0e30f5ccac67&hash=60ACFA1A40137F415D045432B337A7B1; “FY2020 Detailed Financial Report – Statewide Authorization Disposition Total (All BFYs), Summary by Appropriation and Fund,” 232, https://www.michigan.gov/budget/-/media/Project/Websites/budget/Fiscal/Spending-and-Revenue-Reports/Detailed-Financial-Schedules/FY-2020-Summary-by-Appropriation-and-Fund.pdf?rev=5e43ff9f741a49b7a9eca6349207f319&hash=7DFC737A988361EC4EA772C4DA01575C; House Fiscal Agency, “Line Item and Boilerplate Summary General Government, Fiscal Year 2020-21 Public Act 66 of 2020 House Bill 5396 as Enacted,” November 2020, 27, https://www.house.mi.gov/hfa/Archives/PDF/LineItemSummaries/GG_lineFY21.pdf.
29 House Fiscal Agency, “FY 2023-24 APPROPRIATIONS SUMMARY AND ANALYSIS,’ 77, https://www.house.mi.gov/hfa/PDF/RevenueForecast/Summ_Analysis_fy23-24.pdf.
30 “New York State Open Budget, General Government, State Board of Elections, All Fund Types, FP Category Assistance and Grants, Local Assistance Account,” New York State Open Budget, accessed August 28, 2023, https://openbudget.ny.gov/spendingForm-classic.html.
31 South Carolina Elections Commission, “Fiscal Year 2020–2021 Accountability Report,” 30–32, https://www.scstatehouse.gov/reports/aar2021/E280.pdf.
32 “Expenditures (Branch: Executive; Secretariat: Administration; Branch: Department of Elections), Expenditures by Program and Fund, FY 2021,” Virginia Commonwealth Data Point, accessed August 30, 2023, https://www.datapoint.apa.virginia.gov/; Va. Code Ann. §§ 24.2-108, 111, 545; Budget Bill, HB29 (2020), Item 175. T, https://budget.lis.virginia.gov/item/2020/1/HB29/Chapter/1/475/.
33 United States Election Assistance Commission, “2021 Grant Expenditure Report, October 1, 2020 – September 30, 2021,” July 2022, https://www.eac.gov/sites/default/files/paymentgrants/expenditures/EAC_2021_Grant_Expenditure_Report_FINAL.pdf.
34 The Institute for Responsive Government reviewed the FY21 budgets for 23 of Virginia’s localities, including the 11 most populated localities. The localities reviewed include an estimated 53% of the state’s total estimated CVAP (2016-2020 5-year estimate). Across the 23 localities reviewed, the average expenditure per CVAP was $10.41 in FY 2021 (all funds). If that average held across the entire Virginia CVAP population (est. 6,198,540), local spending on elections and voter registration in the state would total $64.5 million, or $57.7 million after deducting the reported $6.8 million in state funding support for localities.
35 Local budgeting is often further restricted by state-level policies that inhibit growth in spending and/or limit tax increases.
Appendix A: Table of State and Local Data Sources and Notes
State Sources and Notes
| Arizona | State of Arizona, Annual Financial Report, Fiscal Year Ending June 30, 2021, p. 14-15, 52-53 | (1) State funding sources for AZ do not include all resources devoted to elections within the Secretary of State’s budget. In FY 2017, certain ongoing election-related expenditures, like ongoing permanent staffing needs, were transferred from the election services line item into the agency’s overall operating budget. Within the operating budget, the elections operating expenses are not appropriated or reported separately (FY 2021 Appropriations Report, Department of State-Secretary of State). (2) All general fund expenditures in FY 2021 are assumed to be distributed to counties based on the descriptions of the appropriations in the FY 2021 and FY 2020 Appropriations Reports (FY 2020 and FY 2021 Appropriations Reports, Department of State-Secretary of State). (3) The annual financial report delineates elections expenditures from the (state) general funds and the election systems improvement fund. Only general funds are counted as state expenditures which may undercount state expenditures. The election system improvement fund consists “of monies received from the United States government; matching monies from state, county, or local governments; legislative appropriations; gifts; grants and donations.” (AZ Rev Stat Sec. 41-129 (2020). The fund appears to be primarily financed with federal HAVA dollars but a detailed breakdown of the original sources of funding used in the 2021 expenditures is not included in the financial report. |
| FY 2020 Appropriations Report, Department of State – Secretary of State | ||
| FY 2021 Appropriations Report, Department of State – Secretary of State | ||
| AZ Rev Stat Sec. 41-129 | ||
| Colorado | Joint Budget Committee, Staff Budget Briefing FY 2022-23, Department of State, A-10 -A-11 | |
| Idaho | Idaho Legislative Services Office Budget and Policy Analysis, Legislative Fiscal Reports, Fiscal Year 2021 | Idaho state funding for SOS elections represent appropriations (not actual expenditures). State funding for local administration represent actual expenditures. The ongoing expenses of elections administration are not broken down within the larger administrative program of the SOS. The figures represented here only reflect specific line-items related to elections and include the election consolidation sales tax which is passed through to counties for election costs related to political subdivision. In addition, Idaho reimburses counties for expenses related to presidential primaries ($2 million in FY 2020) that are not reflected in the FY 2021 figures. |
| ID 2021 Fiscal Facts, p. 24 | The state funding for local administration represents actual expenditures in 2021 for the election consolidation sales tax (2021 Fiscal Facts, p. 24). It does not include reimbursement for presidential primaries ($2 million appropriated in FY 2020; actual expenditures not reported.) | |
| Indiana | IN 2023 Full Budget Report, pp. I-18-19 | The spreadsheet includes actual reported expenditures for the Elections Division. It does not include a $10 million one-time-only appropriation included in the FY 2020 budget for the purchase of “election security equipment.” |
| Kentucky | Office of State Budget Director, Budgets of the Commonwealth, FY 2022 – 2024, p. 31 | |
| Massachusetts | Online Budget Summary, FY 2023 Enacted, Secretary of the Commonwealth | Total state spending on elections includes the following line items: election division administration, central voter registration computer system, early voting, and information to voters. State support for local government includes “grants & subsidies” across all election-related line items in 2021; some of these grants and subsidies may have gone to entities other than local governments. All of the spending reported in the online budget summary are from the general appropriations act, which states that all appropriations are “from the General Fund unless specifically designated otherwise” All the election related line-items are appropriated from the general fund. (General Appropriations Act, p. (PDF) 3, 24). |
| General Appropriations Act, Bill H.5164 191st (2019 – 2020), pp. (PDF) 1, 24. |
||
| Michigan | FY-2021-Summary by Appropriation and Fund.xlsx (michigan.gov), pp. (PDF) 155-157 | Actual 2021 expenditures include the following line items: county clerk education and training fund, election administration and services, and fees to local units. Line items were identified using the descriptions in House Fiscal Agency, General Government, FY 2020-21 Line Item and Boilerplate Summary, p. 27. In addition to the relatively small amount of funding distributed to counties through the DOS, Michigan law requires the state to reimburse counties, townships, and cities for the costs of presidential primary elections. That funding is appropriated to and distributed from the Michigan Department of Treasury. In 2020, the state appropriated a total of $18 million (including a $4 million supplement) to cover the reimbursements. A total of $17.6 million was distributed in FY 2020. |
| House Fiscal Agnecy, General Government, FY 2020-21 LIne Item and Boilerplate Summary, p. 27 | ||
| Legislative Analysis, Presidential Primary Cost Reimbursement, pp. 1-2. | ||
| Statewide Summary Depositions, FY 2020 Summary by Appropriation and Fund, p. (PDF) 232 | ||
| Montana | Election Government Services Division, Legislative Fiscal Division, Secretary of State Revenue and Expenditures by Program Areas (on file with author, produced and provided by Legislative Fiscal Analyst, Kris Wilkinson, on Feb. 8, 2022). | The Election Government Services Division includes operating expenses to support the following limited non-election-related services: Files legislative bills from introduction through approval by the Governor and assigns chapter numbers for the session laws of Montana; files the journals of the legislature; maintains the record of executive reorganization, official acts of the Governor, applications for pardons and commutation of sentence, and requisitions for extradition. Unfortunately, expenses cannot be further broken down between election-related functions and these other governmental functions. |
| New York | New York State Open Budget, General Government, State Board of Elections, All Fund Types, last accessed 8/28/23 | State spending on elections was higher in FY 2021 than any other year from FY 19 to FY 22 and included funding for capital projects in the amount of $9.5 million. (State spending on elections was just $13.5 million in FY 20.) Similarly, state funding to local governments for elections in FY 21 was higher than any other year from FY 19-FY 22, with FY 19 expending just $5,000 in that category. |
| New York State Open Budget, General Government, State Board of Elections, All Fund Types, FP Category Assistance and Grants, Local Assistance Account last accessed 8/28/23 | ||
| North Carolina | North Carolina Open Budget (NC Budget and Spending, Fiscal Year 2021, Actual, General Fund, Filter: State Board of Elections) (last visited 8/29/23) | NCSBE’s responsibilities include campaign reporting and reform (not included in many election budgets). |
| South Carolina | Elections Commission, Fiscal Year 2020-2021 Accountability Report, pp. 30-32 | |
| Virginia | Virginia Commonwealth Data Point, Expenditures, Branch: Executive, Secretariat: Administration; Branch: Department of Elections, Expenditures by Program and Fund, FY 2021, last accessed 08/30/23 |
Local Sources and Notes